 Curves
Phantasm Curves is a live effect/filter that allows color correction of artwork using a curve, similar to Photoshop. As a live effect, it is accessible through the main menu, under Effect > Phantasm > Curves. It can also be applied directly from the Appearance panel using the “Add New Effect” button at the bottom of the panel, or through the Phantasm panel (see Phantasm: Panel).
After applying the live effect using the menu item (or when clicking on the existing effect in the Appearance panel to edit it), the parameters dialog will appear:
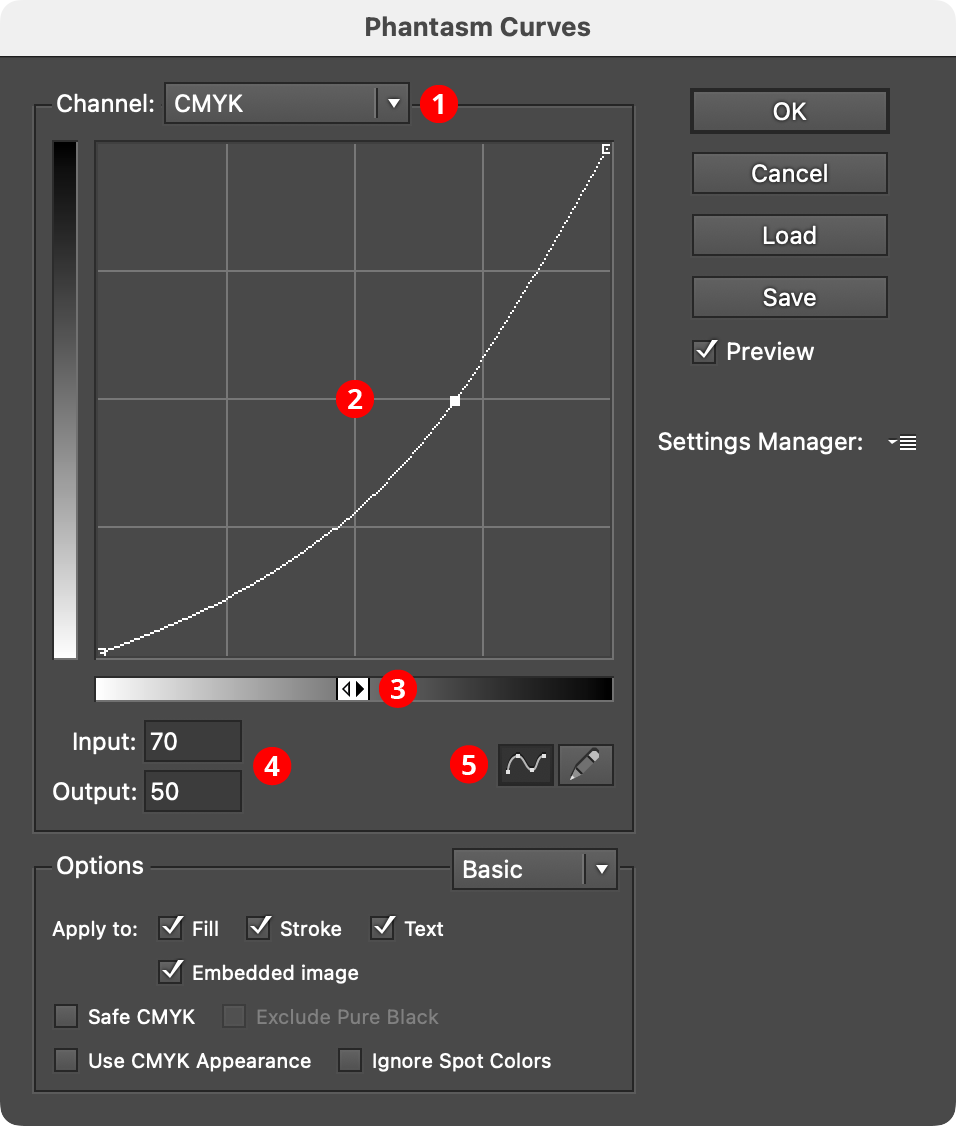
Phantasm Curves Dialog
1. Channel Menu
Specifies which channel or channels the current curve applies to. For CMYK documents, this includes the composite four process colors (CMYK) as well as each individual color. For RGB documents, this includes the composite three primary colors (RGB) as well as each individual color. In both cases, individual spot colors will also appear in the list, as well as Image Alpha, which affects the alpha channel in images with transparency.
Modifying the curve of Image Alpha can be useful for adjusting the output of native live effects which produce an embedded image with transparency, such as Drop Shadow, Outer Glow, and Gaussian Blur:
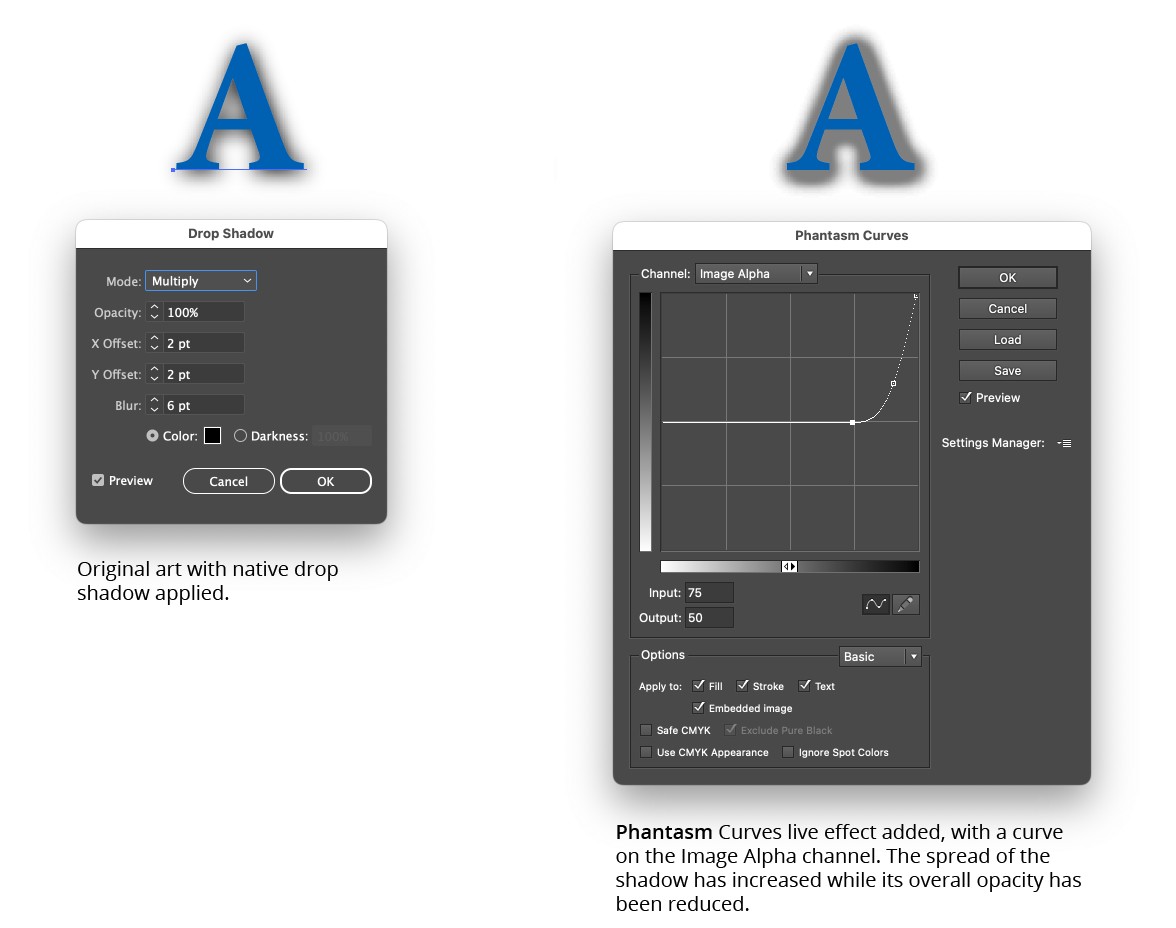
Phantasm Curves Example
2. Curve Graph
The horizontal axis of the graph represents the original brightness values (input levels). The vertical axis represents the new brightness levels (output levels). With the default diagonal line, no colors have been mapped to new values, so all colors have the same input and output values. Nodes on the curve may be moved simply by clicking and dragging them (or their input and/or output values may be modified, see below). A new node may be added by clicking at a spot along the curve which does not already have a node. A node (except the one at the beginning and the one end of the curve) may be deleted by dragging it off the graph area.
By default, the graph has a 4×4 grid, but Option/Alt-clicking on the graph will change the grid to 10×10.
3. Tonal Bar
By default, the graph goes from 0% (white) at lower-left to 100% (black) at upper right, but clicking on the tonal bar icon or the tonal bar itself will switch the graph to go from 0 (black) at lower-left to 255 (white) at upper right.
4. Input/Output levels
These values reflect the selected node, and may be edited to re-position the node.
5. Curve/Map Mode Buttons
By default, the graph is shown as a curve running through individual nodes, but by clicking on the Map button (pencil icon), each point along the axis may be freely drawn on the graph, and may contain discontinuities. Drawing across an existing graph will overwrite the previous lines. If a graph has been drawn in Map mode and the Curve mode button is pressed, Phantasm will approximate the lines as best as it can using a continuous curve. If no nodes are edited and the mode is switched back to Map, the original lines will be restored.
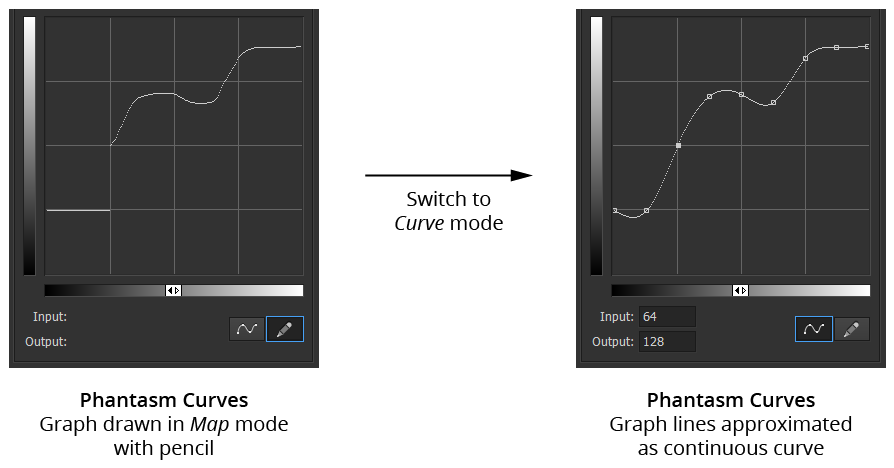
Phantasm Map Mode to Curve Mode