- Getting Started
- Training
- Features
- Effects
-
Plugins
- AG Core
- AstuteBuddy
- Autosaviour
- ColliderScribe
- DirectPrefs
- DynamicSketch
- FindReplace
- InkFlow
- InkQuest
- InkScribe
- MirrorMe
- Phantasm
- Randomino
- Rasterino
- Reform
- Stipplism
- Stylism
-
SubScribe
- Getting Started
- Circle by Points Tool
- Tangent Circle Tool
- Curvature Circle Tool
- Arc by Points Tool
- Tangent Line Tool
- Perpendicular Line Tool
- Connect Tool
- Straighten Tool
- Lock Unlock Tool
- Orient Tool
- Quick Orient Tool
- Orient Transform Tool
- AG Layer Comps Panel
- Art Switcher Panel
- Gradiator Panel
- Gradient Forge Panel
- AG Color Select Tool
- Color Stamp
- Gradient From Art
- Pixels to Vector
- QuickOps
- Texturino
- VectorFirstAid
- VectorScribe
- WidthScribe
- FAQs
- Updates
- Team Licensing
- Reseller Licensing
- Astute Manager
If you enable the display of Curve Normals in the preferences, Dynamic Measure can draw these normals when hovering over a path while holding down Shift. The number of normals is controlled by the “Divisions” setting in the preferences.
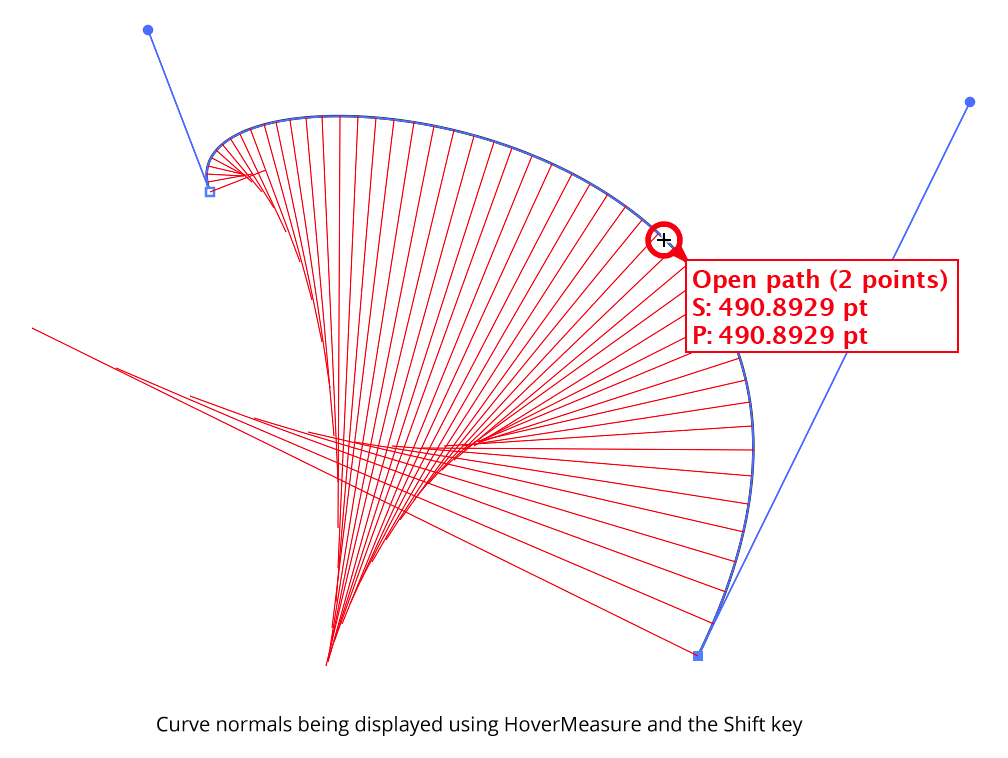
Dynamic Measure Curve Normals Example
To see the curve normal at the cursor point only, hold down Option/Alt rather than Shift. The single curve normal is drawn in blue. Or, you can hold Shift+Option/Alt to see both.
Each line has a length equal to the radius of curvature at the point where the line touches the curve; each is angled normal (perpendicularly) to the curve at that same point. The outer ends of the lines therefore trace out the evolute of the curve. The lines are spaced according to the changing t-parameter of the bezier curve, which changes faster in flatter parts of the curve. You can convert the curve normals into actual paths by clicking while they are being displayed. They will be created as a group at the back of the current layer, with a line style of black, 0.25 pt. They can, of course, be edited like any other artwork afterwards.