 Dynamic Measure Tool
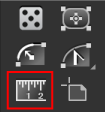
Dynamic Measure Tool Location
The Dynamic Measure tool is used to create, edit, delete, or convert measures. It has a cursor like a small crosshair. To make a measurement, click once at the start point and again at the end point (this method can be changed to click-and-drag in the preferences). The start and end points will be connected by a thin line (red by default), and an arrow showing the direction. Measurement values appear both in the Info panel and, by default, in a box next to the cursor.

Dynamic Measure Overview
Information about the path under the cursor is also displayed by default, using a feature called “Hover Measure” (see below).
New Measures
After the mouse button is released, the default behavior is for the measure to remain on the screen indefinitely, even when the Dynamic Measure tool is deselected. Measures are undoable, and are saved with the document. To cancel a measure in progress, press the Esc key while moving the cursor. To constrain a measure to horizontal and vertical directions (as well as 45° increments), hold down Shift when measuring. To snap while constraining or to constrain a measure to the general constrain angle, turn on Smart Guides.
By default, Dynamic Measure snaps the cursor to paths and guides, anchor points, and handles and draws a ring around the cursor to indicate this. When Smart Guides are enabled, Dynamic Measure will also snap to path intersections and centers, page edges, etc. A small triangle on the snapping ring(s) indicates path direction. Selected paths take precedence over unselected path when both are within snapping range.
In addition to straight-line distance, Dynamic Measure can measure the distance between two places on a path by enabling the “Distance Along Path” setting. For open paths, this measurement value is indicated by the heading ”DP:”. In the case of a closed path, there are two ways we can go “along” the path to get from the first location to the second, so the values are abbreviated as “DWP” (Distance With Path, i.e., in the direction of the path) and “DAP” (Distance Against Path, i.e. against the direction of the path):
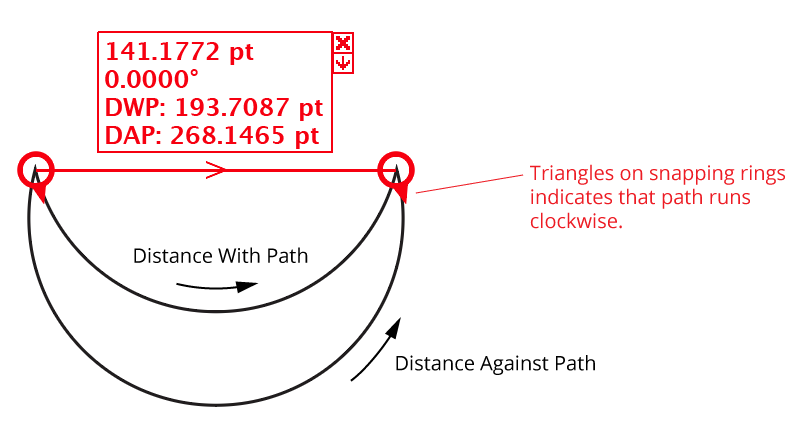
Dynamic Measure Distance along a path
Editing Measures
An existing Dynamic Measure can be edited by pressing Option/Alt with the cursor hovering over one of the endpoints. An annotation with four arrows will appear, indicating that the endpoint may be relocated by clicking. Afterwards, the measure acts similarly to a new measure.
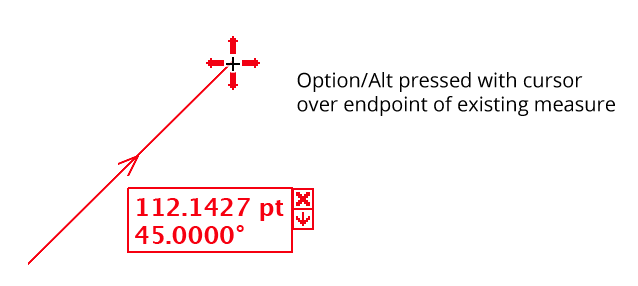
Dynamic Measure Moving existing measures
Deleting Measures
Dynamic Measures can be deleted using the tool in two ways. The first is the simply click the “Delete Measure Button,” which is the small “X” icon that appears by default at upper right. The second way is to hover the cursor over the text area of the measure and hold down the Option/Alt key. The measure will become lighter, and clicking will delete it. If Shift is also held down, then all existing measures will be deleted:

Deleting all Dynamic Measures
Converting Measure to Artwork
To convert a Dynamic Measure into editable artwork, click the “Convert Measure Button,” which is the small icon that looks like a down arrow. While the cursor is over the button, the measure and its data will become bolder as a visual indication of the convert operation.

Dynamic Measure - Converting measures into artwork
To convert all existing measures into artwork, hover the cursor over the text area of any measure and click with the Shift key held down.
The new art is created in a new layer at the top of the layer stack named “Dynamic Measure” (unless such a named layer already exists, in which case that existing layer is used). Each measure is created as a separate group, making it easy to hide or delete one. When first created, the “Dynamic Measure” layer is locked by default, but if you unlock it, it will be left that way.
By default, Dynamic Measure uses a 0.25 pt black rule for the measure line and arrowheads and 8pt/8pt type (with all other characteristics being inherited from the Normal style) for the text data. Dynamic Measure creates both a new graphic style and a new character style for these items the first time you convert measures to paths, both with the name “Dynamic Measure” (unless styles with this name already exist, in which case they are used as is). You can therefore change the look of all of the converted measures — for instance, color, thickness of the line, type style — by simply editing these styles.
HoverMeasure
Dynamic Measure can display information about paths, anchor points, and handles simply by hovering the cursor over the item of interest. The fields which are displayed are specified in the preferences dialog. By default, they include path information (type and number of points); length of the path segment; length of the entire path; coordinates of anchor points and handles; and length and angle of handles.
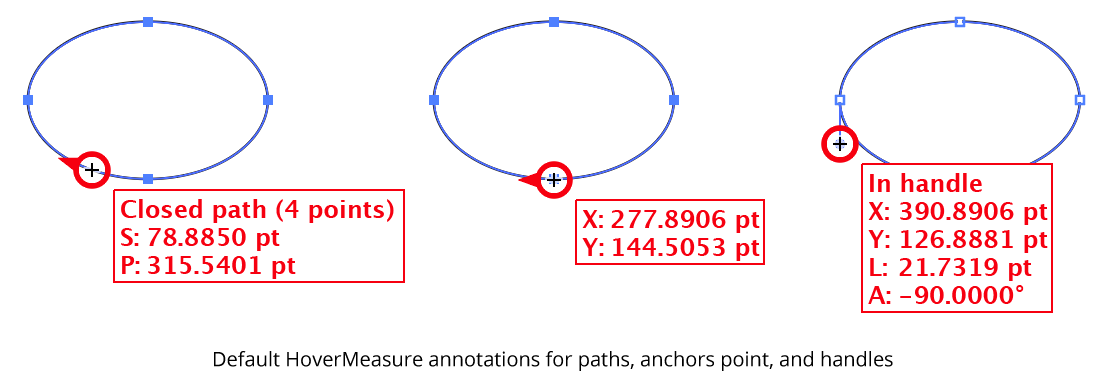
Dynamic Corners HoverMeasure
The path does not need to be selected; however, selected paths take precedence over unselected paths, even if they are underneath them.
Curve Normals
If you enable the display of Curve Normals in the preferences, Dynamic Measure can draw these normals when hovering over a path while holding down Shift. The number of normals is controlled by the “Divisions” setting in the preferences.
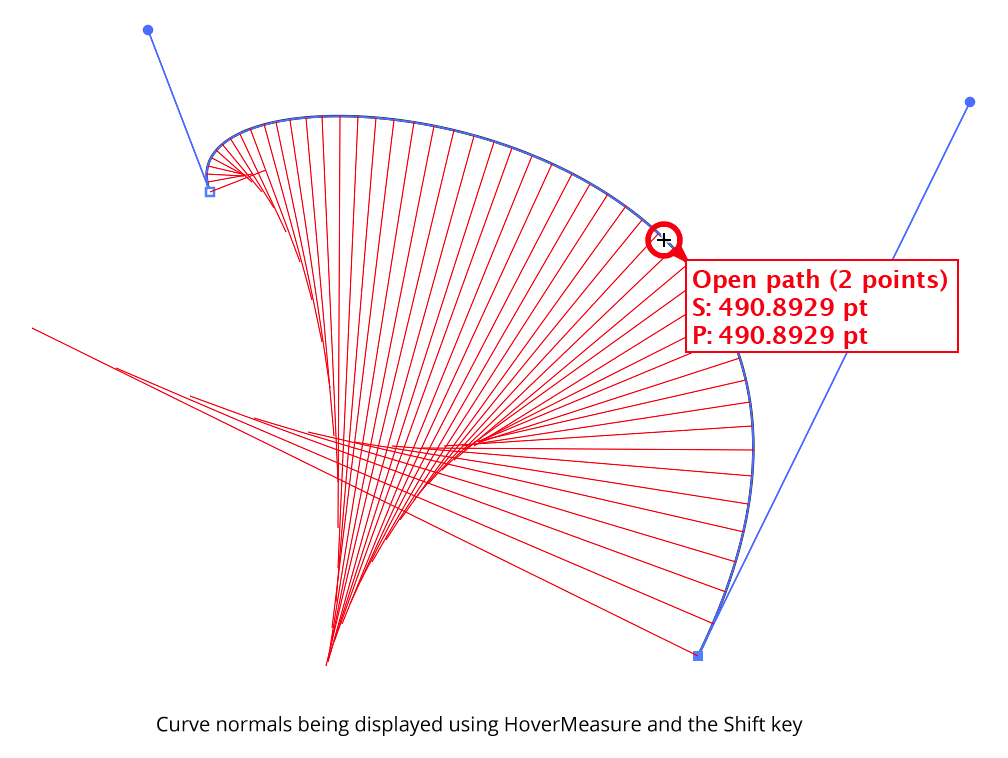
Dynamic Measure Curve Normals Example
To see the curve normal at the cursor point only, hold down Option/Alt rather than Shift. The single curve normal is drawn in blue. Or, you can hold Shift+Option/Alt to see both.
Each line has a length equal to the radius of curvature at the point where the line touches the curve; each is angled normal (perpendicularly) to the curve at that same point. The outer ends of the lines therefore trace out the evolute of the curve. The lines are spaced according to the changing t-parameter of the bezier curve, which changes faster in flatter parts of the curve. You can convert the curve normals into actual paths by clicking while they are being displayed. They will be created as a group at the back of the current layer, with a line style of black, 0.25 pt. They can, of course, be edited like any other artwork afterwards.
